
The annual Social Security cost-of-living adjustment (COLA) is one of the most important developments for retirees and consumers. It determines the increase in benefits next year, and it also reflects the broader inflationary trends affecting all consumers and investors. This is especially relevant today as inflation continues to add pressure to many households.
The Social Security Administration recently announced a 3.6% 2027 Social Security COLA, one of the highest in recent decades. While this is a healthy increase on paper, the reality is that this adjustment is one part of an overall strategy for maintaining purchasing power as prices rise. For long-term investors, it is important to understand what is driving inflation, what it means for cash yields, and how it affects portfolios.
The 2027 COLA reflects higher energy prices
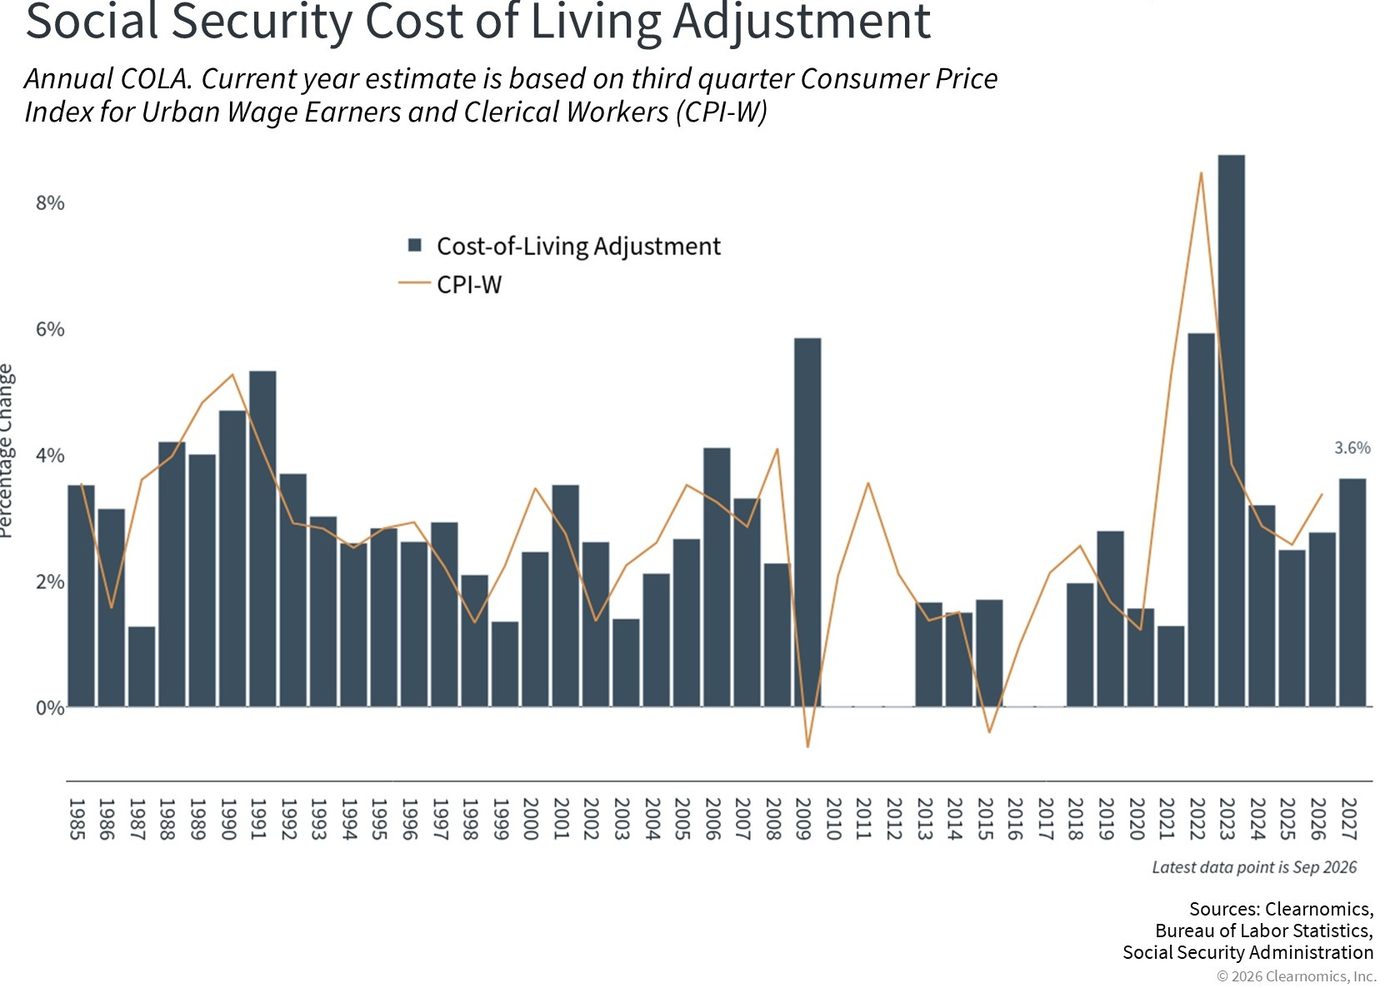
Inflation has faced two competing trends over the past year. Pandemic-era pressures have been improving, with the Consumer Price Index decelerating from a peak of 9.1% year-over-year in 2022 to 2.7% at the start of 2026. However, rising energy prices due to the war in Iran have pushed inflation higher in recent months, with the latest CPI figure showing prices up 3.7% over the past year.
This is why the 3.6% COLA for 2027 is the fifth-largest increase in over 35 years, the highest since the 8.7% adjustment that took effect in 2023, and well above the 3.1% average over the past decade.
COLA is calculated using a version of the Consumer Price Index known as the CPI-W, which focuses on “urban wage earners and clerical workers” and compares third-quarter price levels against the same period a year earlier.
The challenge is that one number cannot reflect the needs of all retirees. The latest figure means the average recipient will see approximately $75 more per month beginning in January 2027, which may not fully offset rising costs for healthcare, prescription drugs, and other necessities.
By comparison, an experimental measure known as CPI-E tracks households headed by adults aged 62 and older. Since seniors spend more on inflation-sensitive areas such as healthcare and housing, CPI-E generally rises faster than CPI-W: from January 1985 to January 2025, CPI-E rose 221% while CPI-W increased 197%. That said, no single index can capture every household’s experience.
For retirees enrolled in Medicare, the monthly Part B premium is projected to rise by $6.60 to $209.50. Since this amount is typically deducted from Social Security checks, it will partially offset the COLA increase, and Part D prescription drug costs are rising as well. The actual gain in purchasing power for many retirees could be smaller than the headline percentage suggests.
Consumer spending is supporting broad economic growth
When it comes to broader economic trends, inflation continues to impact many parts of the economy. Headline CPI rose 3.7% year-over-year in September, with gasoline prices, which surged 9.1%, accounting for more than half of the monthly increase. In contrast, core CPI, which excludes food and energy prices, rose only 2.6%.
These figures suggest that the primary driver of today’s inflation is still energy, rather than broad-based price pressures across the economy. An even narrower measure, sometimes called “supercore” inflation since it excludes food, shelter, and energy, rose only 2.0%.
It’s natural for higher inflation to hurt consumer sentiment, which has fallen to historic lows. Despite this, consumer spending remains strong: retail sales grew 6.3% over the past year in September, although gasoline accounted for roughly 71% of the monthly increase.
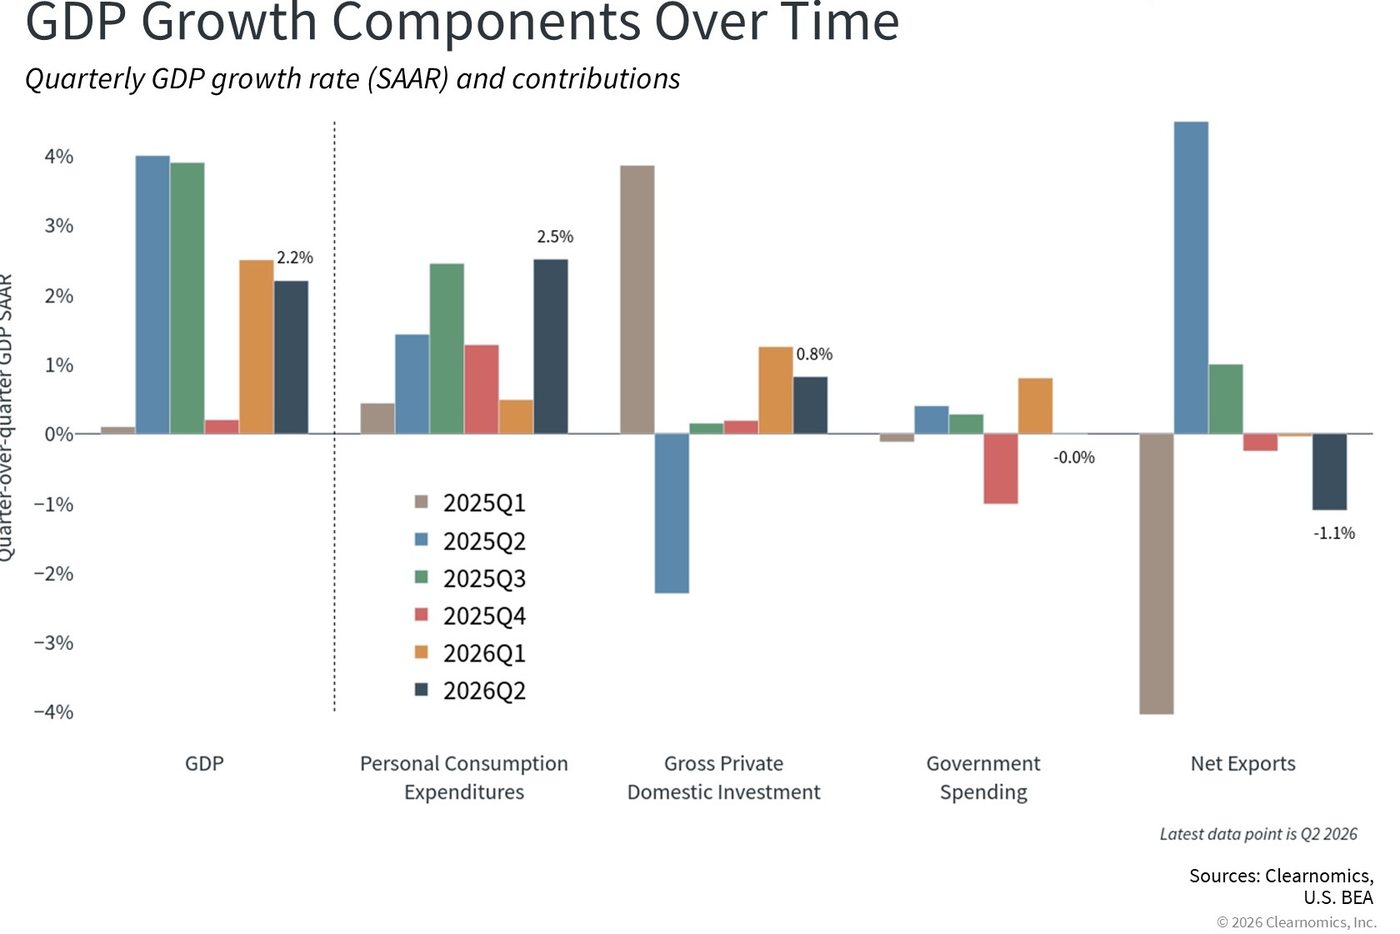
All of these factors influence real Gross Domestic Product (GDP) growth, which excludes the effects of inflation. Despite higher inflation and uncertainty in the labor market, consumer spending has been strong, as shown in the chart above, and business investment has remained steady, supported by ongoing AI-related capital spending on data centers and infrastructure. Together, these factors have supported broad economic growth, corporate profits, and financial markets.
Cash yields are still lagging behind inflation
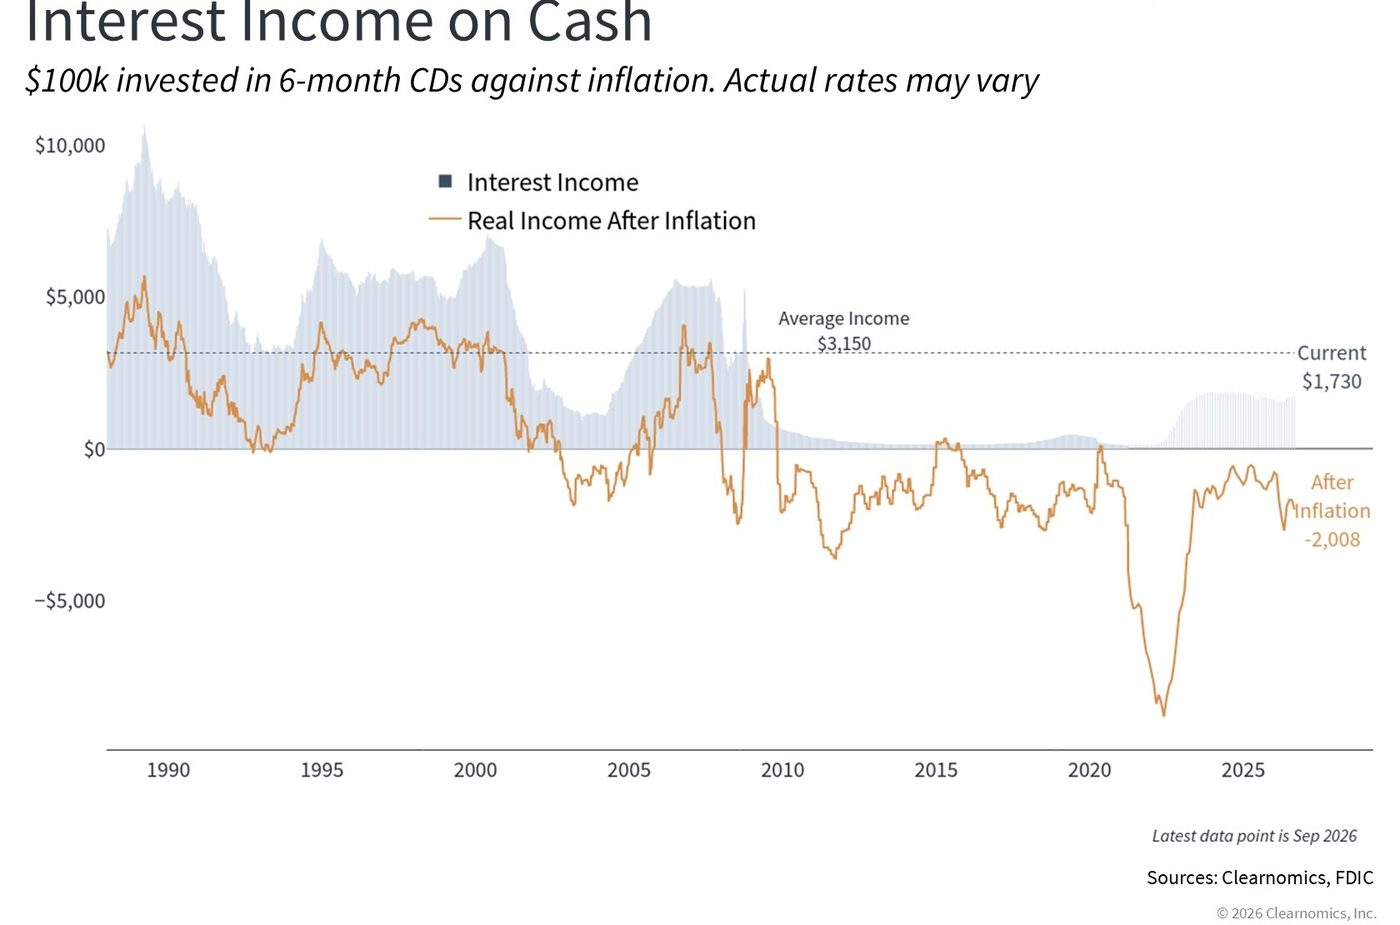
While economic growth continues to be stable, inflation creates additional challenges for long-term investors. Even though nominal rates are elevated compared to much of the past decade, inflation-adjusted yields on cash remain lower than many investors might expect.
The chart above shows interest income on cash, calculated using FDIC average yields on six-month certificates of deposit. While these rates are higher than in the past, they are still not keeping pace with inflation. Specific products may offer higher rates, but they require active management. Maintaining the purchasing power of savings remains a challenge, underscoring the importance of a long-term plan and a portfolio that can generate inflation-adjusted returns.
This is why looking beyond cash and the 2027 Social Security COLA remains important for overcoming inflation. A balanced portfolio of stocks and bonds, when structured properly, can potentially offer more attractive real returns than cash alone. Investment-grade corporate bonds, for example, currently offer yields well above their long-run averages.
The bottom line? The 2027 Social Security COLA of 3.6% is a reminder that inflation remains a real challenge due to higher energy prices. Maintaining a balanced portfolio that doesn’t rely on cash or benefit adjustments alone continues to be the best way to maintain and grow purchasing power.
Disclosure: Stonebrook Private LLC (“Stonebrook”) is a federally registered investment adviser under the Investment Advisers Act of 1940. Registration as an investment adviser does not constitute an endorsement of Stonebrook by the SEC nor does it indicate that Stonebrook has attained a particular level of skill or ability. This material is provided for educational and informational purposes only and does not constitute investment advice, a recommendation, an offer to buy or sell, or a solicitation of any security, strategy, or investment product. All investing involves risk, including the possible loss of principal. Past performance is not indicative of, and is no guarantee of, future results. Diversification and asset allocation do not ensure a profit or protect against loss in declining markets. Information herein was obtained from various sources believed to be reliable; however, Stonebrook does not guarantee, and accepts no liability for, the accuracy or completeness of information provided by third parties. Charts and data are provided by Clearnomics, Inc. and other third-party providers. Sources may include Standard & Poor’s, LSEG, Bureau of Labor Statistics, and similar providers. Indexes are unmanaged and not investable. Index performance does not reflect the deduction of advisory fees, transaction costs, or other expenses.